D’Oh! It’s the hapaxes. And how lexicography is an uphill battle
In the
previous post
I was wondering about the significance of an odd shape I found when I projected the headwords of various Chinese dictionaries onto a word list ranked by frequency. A reader suggested I check out MOEDICT next, which I did this morning.
And then it hit me. It was data sparsity hiding in plain sight. What an embarassingly trivial mistake to make! I’m glad I’m not building bridges or power plants. And yet… even though an army of hapaxes just ate my precious theory for breakfast, there are still a few interesting points here.
MOEDICT
國語辭典, or MOEDICT, is Taiwan’s de-facto standard monolingual dictionary, which was open-sourced in 2013. (Publishers everywhere, take notice.)
There are only two difficulties. First, the dictionary is published as a SQLite database: an odd choice that makes it just that much harder to access the information inside. Second, coming from Taiwan, it uses the traditional script, while the SUBTLEX-CH frequency list contains simplified words.
Yet MOEDICT’s 160 thousand headwords are an attractive enough bounty that makes it worth the effort. I’ll spare you the details; for the traditional>simplified conversion I used OpenCC, an elaborate and actively maintained tool. And the result is…

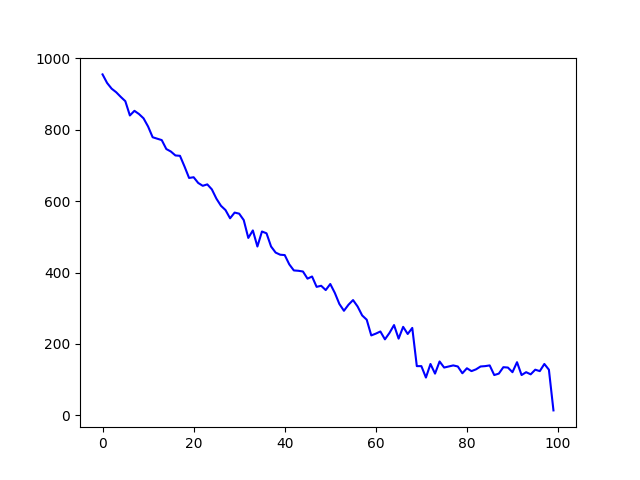
Yup, that’s the exact same shape I got for the other dictionaries. And it’s practically impossible that MOEDICT influenced CC-CEDICT’s headword list in any significant way. So, having eliminated my preferred conjecture, it’s either a ghost in the machine (a quirk of the frequency data), or I just discovered something terribly exciting.
The data sparsity ghost
Of course it’s the data. It’s not even some intricate quirk, as I realized when the odd suspicion hit me and I took a closer look at the frequency list.
From rank 69,006 onwards it’s all hapaxes: words that occur only once in the entire corpus. Frequency 2 starts at rank 58,241; frequency 3 at 52,189. Those ranks correspond to the boundaries of the plateaus.
The plateaus themselves are easy to explain, then. At higher frequencies (the left half of the graphs) neighboring buckets have distinct average frequencies. In the long tail of the right half, lots of neighboring buckets have the same frequency throughout (3, 2 or 1). They are homogenous, so constant coverage with a little randomness thrown in is precisely what we expect.
I allowed myself to be led astray by the power law distribution. The bottom right corner of the log-log graph in my previous post shows a ragged shape. But it’s just a tiny corner, right? Well, that corner accounts for half of the words on the frequency list. And these 47 thousand words account for only 70 thousand of the corpus’s 33 million tokens. Power law, d’oh.
Divergence and black matter
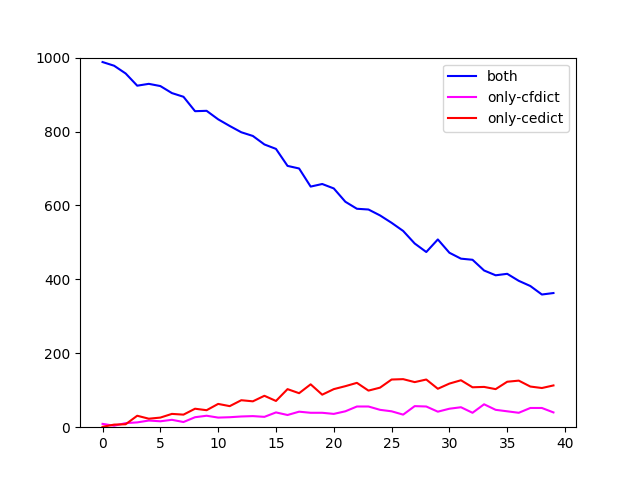
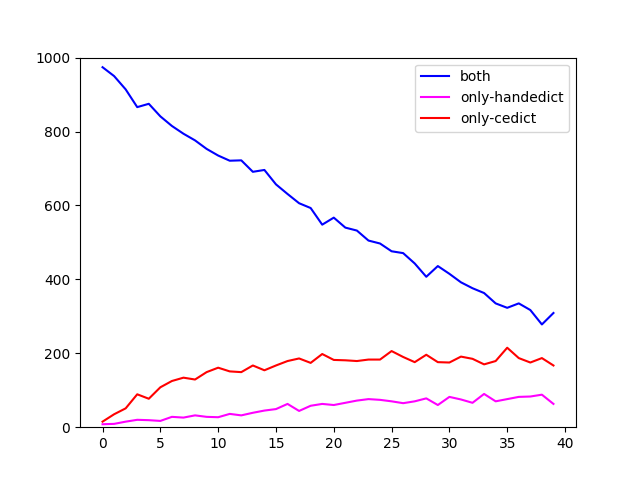
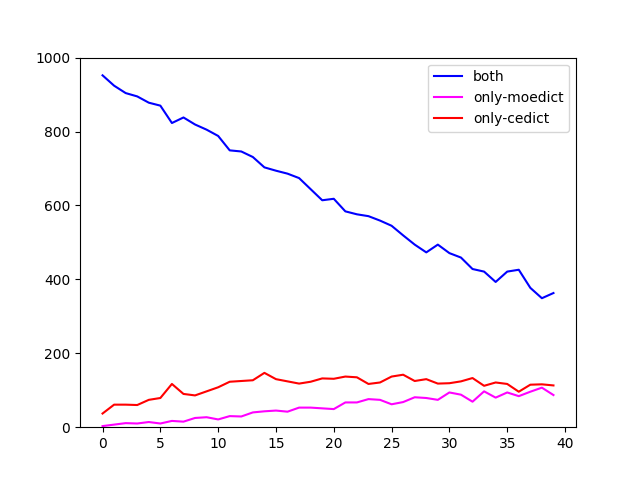
Undeterred by this realization, I went on to cross-examine the four dictionaries a bit more, restricting myself to ranks 1 through 40k. I looked at them in pairs (CC-CEDICT plus one of the others) and checked how many words they share in each bracket (blue line), versus how many words are contained in only one or the other. Here are the plots.


I cannot project anything into these graphs that would argue for or against a shared genealogy of the open source ones, although CFDICT seems to deviate less from CC-CEDICT than the others. What strikes me is the high divergence between the coverage of seemingly any two dictionaries. Clearly it’s not easy to pinpoint what, exactly, makes up a language’s vocabulary.
And that leads on to the other obvious fact: there is a large number of words that have been attested in the corpus but are not in any dictionary. That’s the entire area above the line from the graphs in the last post. Granted, coverage is high in the high frequency ranges, which means that the majority of instances in actual texts are covered. But, conversely, it’s also true that you’re certain to come across words that are not in any compiled dictionary if you just read on for a while. It’s an uphill battle, lexicography.