Fast line hiding with a WebGL shader for pen plots
You don’t need to worry much about Javascript’s performance if you can offload your heaviest computations onto the GPU using WebGL. Here’s how I sped up my canvas-based line hiding algorithm from 300 seconds to 30 msec to render beautiful 3D images with the pen plotter.
The appeal of line hiding
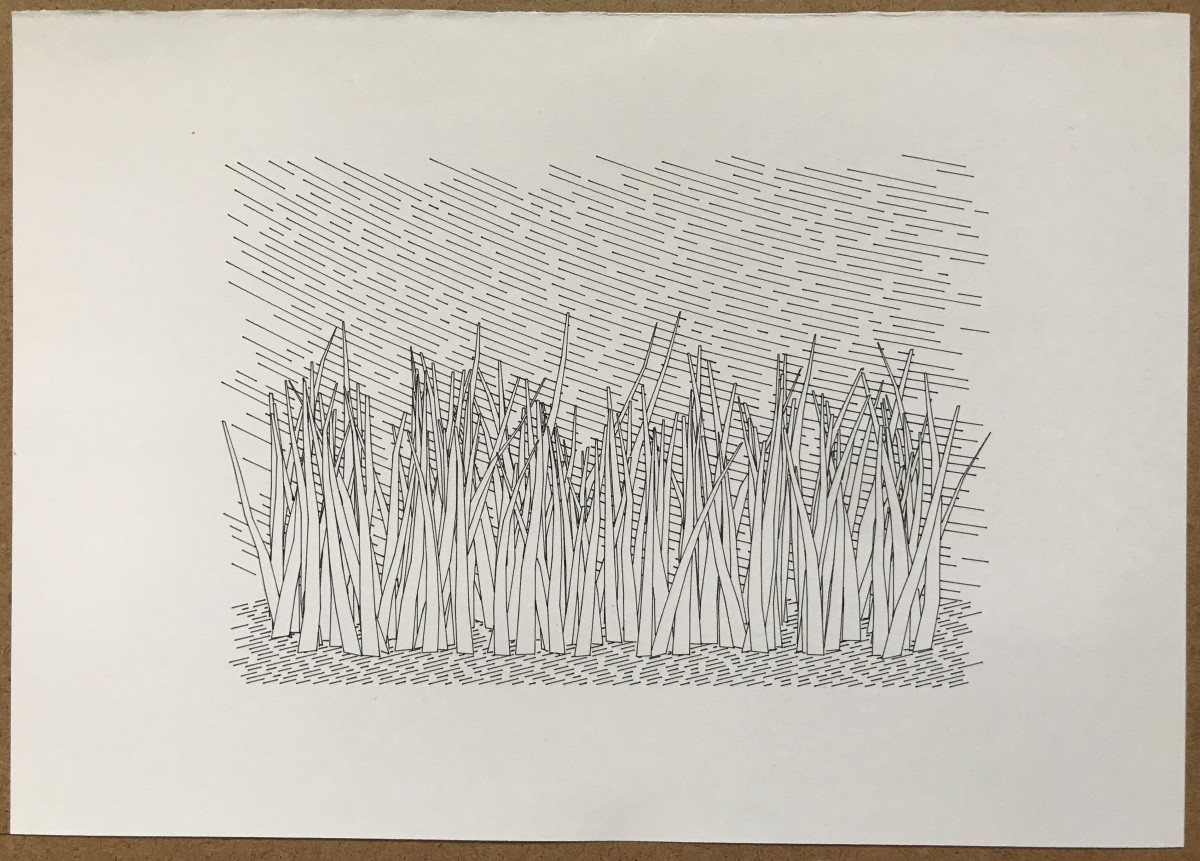
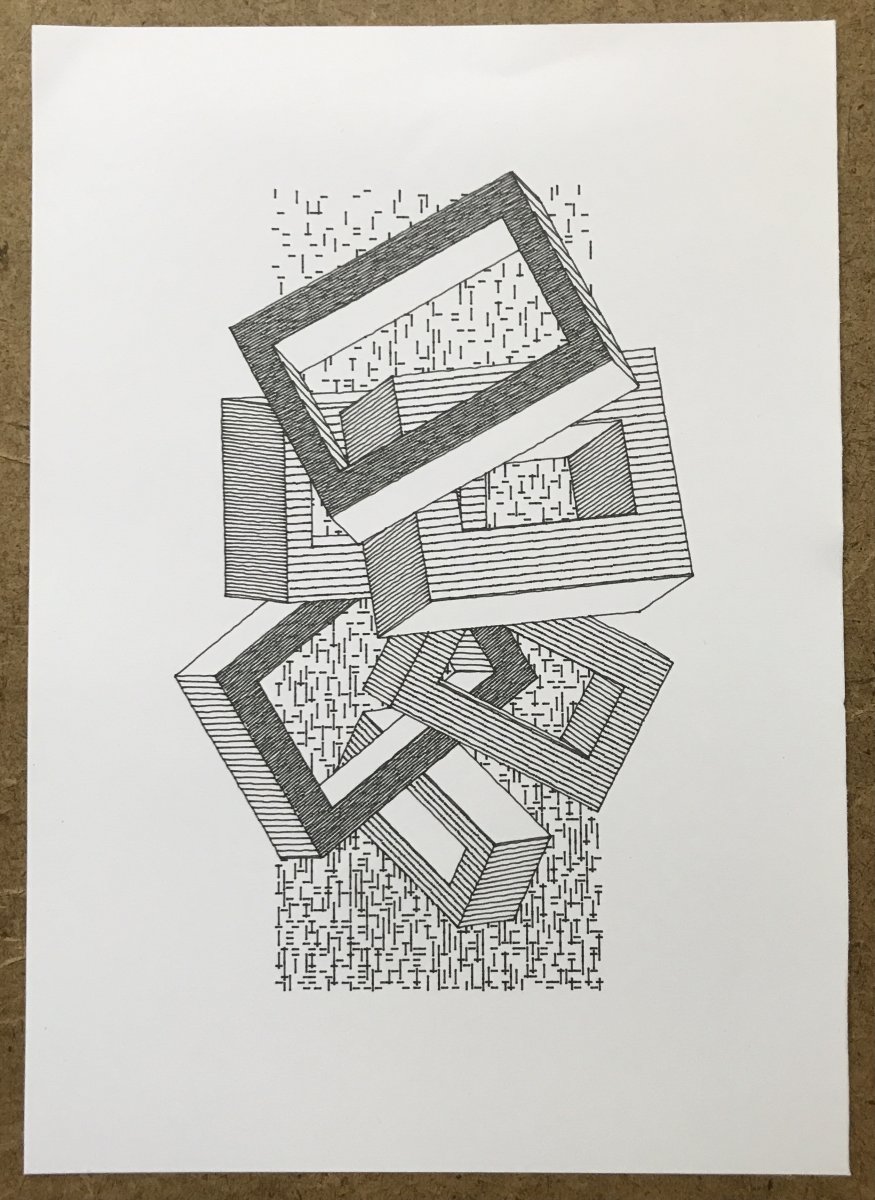
A lot of my pen plotter work plays with things hiding other things. Sometimes it’s two-dimensional shapes blocking other shapes; sometimes it’s a pattern filling only the inside of a closed shape; sometimes it’s three-dimensional objects blocking parts of each other from view.
The root of this fascination with line hiding is the fact that in a pen drawing, once you’ve drawn a line your cannot make it disappear by painting over it. You must know in advance what’s visible and what’s not. When you paint on a canvas, you can work your way up from the background and paint over things. In a pen plot, you must figure out exactly what parts of the background will be visible and what must not get drawn.
Existing tools
I haven’t come across many tools that address this with vector graphics. One fascinating example is
“ln,”[1] Michael Fogleman’s sweet and sharp tool written in Go that generates the visible lines of 3D geometric shapes.
I have heard that Blender[2] can export plottable SVG files from 3D scenes. In my own Javascript work I started using the
Paper.js[3] library precisely because it comes with a powerful bag of polygon intersection methods.
None of these are an optimal match for my own creative process. “ln” won’t work simply because it’s not in Javascript, which is where I have built out my environment. I work in a very code-centric way, and in that context Blender is just an extra tool that I would need to learn and integrate. Paper.js doesn’t help with 3D shapes, and its performance hits a wall if I have complicated 2D shapes, or simply too many shapes.
[Update: tca@genart.social points out that Trammell Hudson's Plotter Vision[11] does something similar for STL meshes. It uses a geometric approach, and the crisp and clear source code is really worth studying.]
Sampling canvas pixels
To avoid the complexity of calculating polygon intersections, I opted for a brutally simple approach. I keep a regular canvas around where I draw shapes with a solid fill, and use these shapes as either a positive or a negative mask to decide what parts of my lines are visible. For the composition above, the canvas with the masks looks something like this:
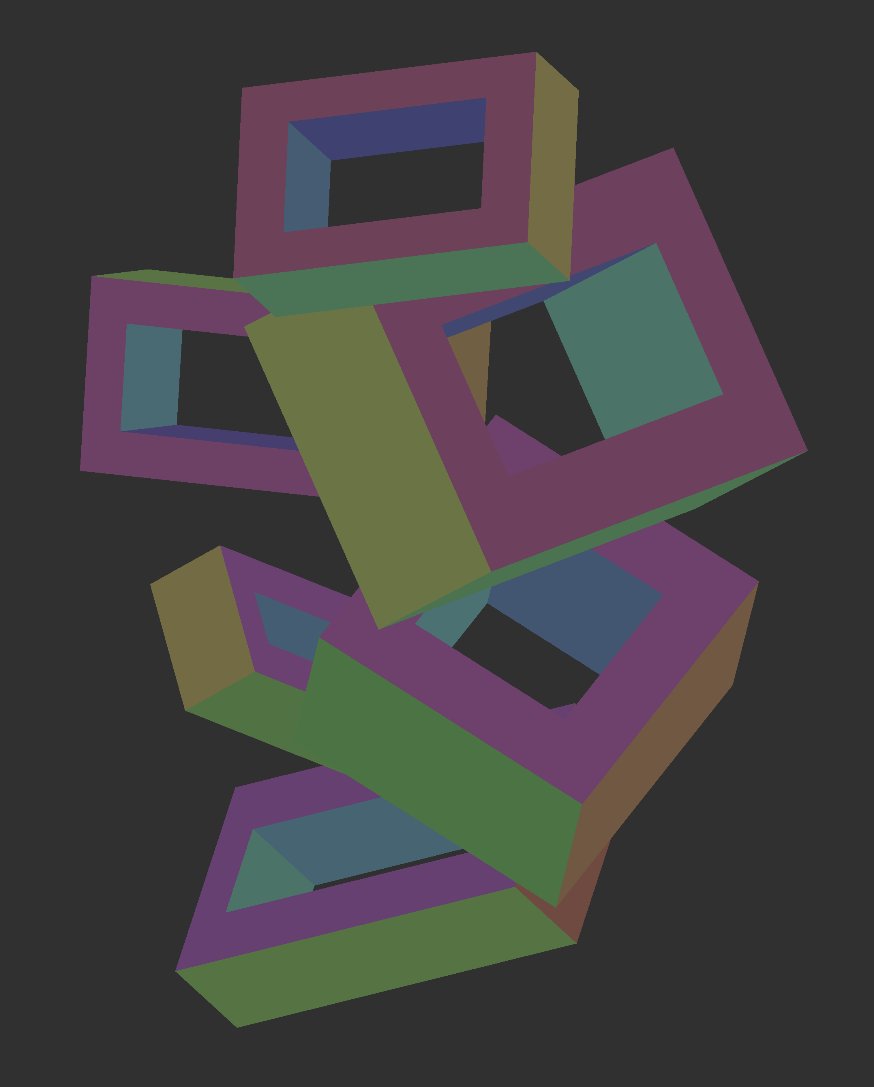
A few details about this method:
- To test what sections of a line are visible, I iterate along the line’s points in small increments and check the color of the image at the each location.
- The canvas has a high enough resolution, and I move along the line in small enough steps, that the approximate nature of this approach is not noticeable in the plot. If your pen’s tip is 0.2 mm, then you don’t really need a precision finer than that.
- When testing a line at the edge of a filled shape, many of the points on the canvas will have the wrong color, even if the image was rendered with no anti-aliasing. So for edges I look a bit to the left and right as well (and maybe diagonally), and if I find at least one pixel of the right color, I consider this point of the line to be visible.
The beauty of this approach is that it works with 3D shapes too. I can use Three.js[4] to build a real three-dimensional scene. I render the composition onto the canvas, and project vertices into the same 2D space. I can then walk an edge between two projected vertices and test its points. The 3D rendering engine has taken care of what’s visible and what’s hidden without me needing to calculate intersections or trace rays.
Although Three.js renders with WebGL, this is not yet the part of my method where I use WebGL to speed things up. Keep reading!
Hack or not?
But first, a brief aside...
There’s a point to be made that this is really just a hack and not a real solution. It doesn’t calculate precise vector coordinates through a closed formula or at least a numerical method. It just steals information from a rasterized image.
To which I say: if it’s good enough for zancan[5], it’s good enough for me! Here’s the Twitter conversation[6] from April 2021 where he shared his approach. I screenshotted it for posterity :)


Optimizing on the CPU
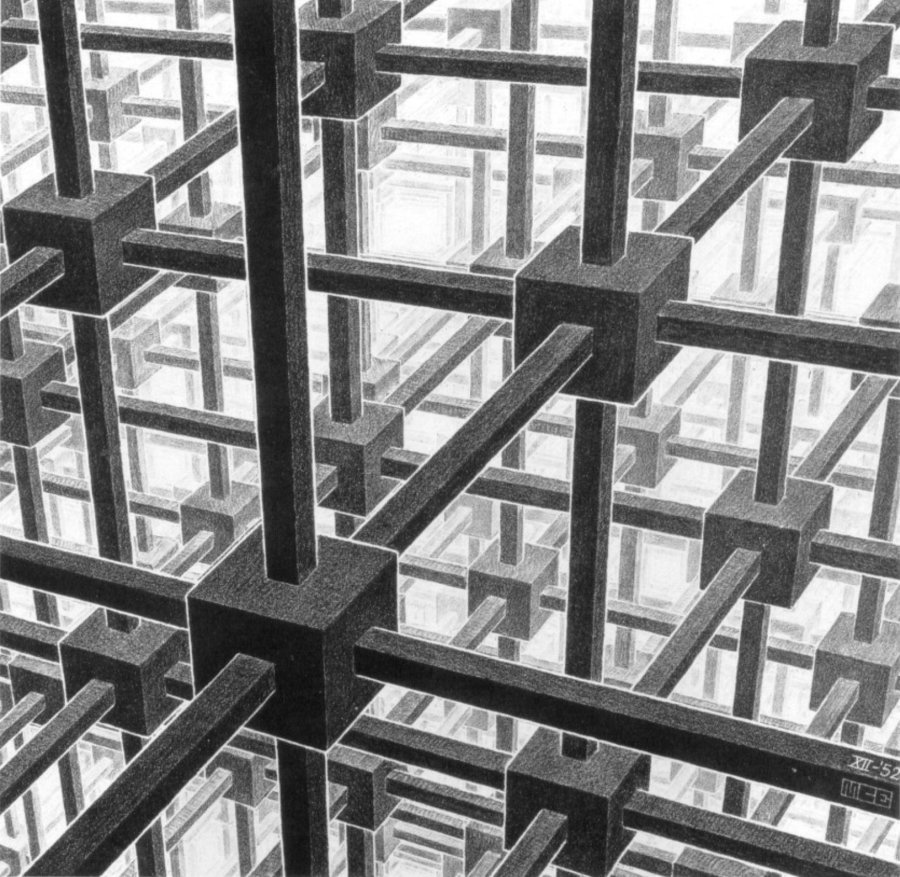
Once I had a naive implementation of the pixel testing approach working reliably, I wanted to put it through its paces on something complicated. I remembered seeing Reinder’s recreation[7] of Escher’s original Cubic Space Division[8] on Turtletoy and decided to try and plot it myself.
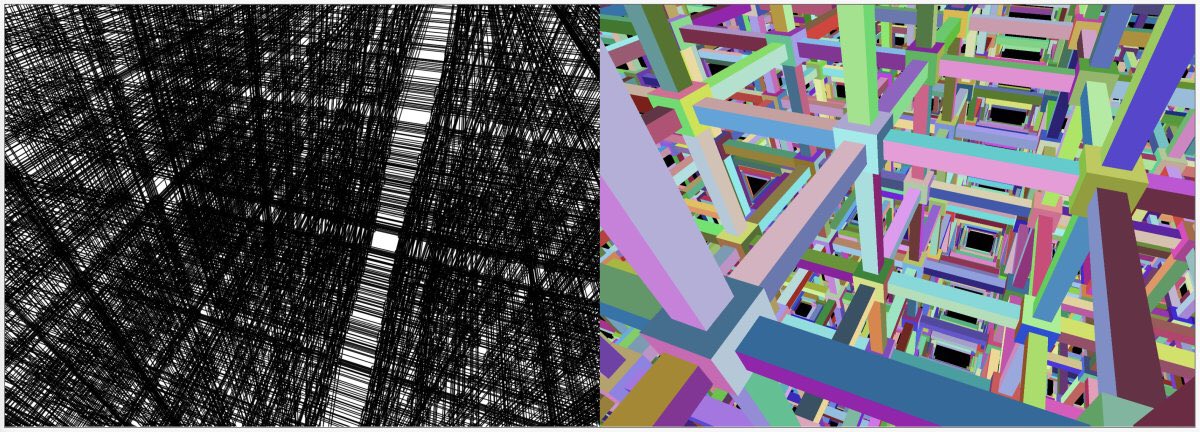
Round 1: Naive and dumb approach
Below is the first, rather thoughtless version of my line hiding function. Running this on the scene from the image above took about 5 minutes, or 300 seconds.
function get3JSMaskedLine(pt1, pt2, pixels, clr1, clr2) {

  // Build points: short segments of the requested length
  const lineVect = pt2.subtract(pt1);
  const lineLength = lineVect.length;
  const nSegs = Math.max(2, Math.round(lineLength / segLen));
  const segVect = lineVect.divide(nSegs);
  const pts = [];
  for (let i = 0; i <= nSegs; ++i) {
    pts.push(pt1.add(segVect.multiply(i)));
  }
  let orto = pt2.subtract(pt1).rotate(90);
  orto.length = 1;

  let visibleLines = [];
  let firstVisible = null
  for (let i = 0; i < pts.length; ++i) {

    let pt = pts[i];
    let clrHere = getPixel(pixels, pt.x, pt.y);
    let isVisible = clrEq(clrHere, clr1);
    if (!isVisible) isVisible = clrEq(clrHere, clr2);
    if (!isVisible) {
      clrHere = getPixel(pixels, pt.x + orto.x, pt.y + orto.y);
      isVisible = clrEq(clrHere, clr1);
      if (!isVisible) isVisible = clrEq(clrHere, clr2);
    }
    if (!isVisible) {
      clrHere = getPixel(pixels, pt.x - orto.x, pt.y - orto.y);
      isVisible = clrEq(clrHere, clr1);
      if (!isVisible) isVisible = clrEq(clrHere, clr2);
    }

    if (isVisible && firstVisible == null) firstVisible = pts[i];
    else if (!isVisible && firstVisible != null) {
      if (firstVisible != pts[i - 1]) visibleLines.push([firstVisible, pts[i - 1]]);
      firstVisible = null;
    }
  }
  if (firstVisible != null && firstVisible != pts[pts.length - 1]) visibleLines.push([firstVisible, pts[pts.length - 1]]);
  return visibleLines;
}
A few remarks:
- pt1 and pt1 are Paper.js Point objects
- pixels is a Uint8Array that was retrieved from the canvas’s context through getPixels
- getPixel is a helper function that rounds the coordinates and retrieves the RGB pixel values
- clrEq is a helper function that permissively compares two 3x8-bit RGB colors, allowing a difference of 1 in either channel
Round 2: Naive and less dumb
In the previous round, the code calling the function above tested a lot of unnecessary points. A large part of the 3D scene is not visible on the canvas: entire edges are off to the side, or even behind the camera. Because these tend to be close to the camera, they are also very long lines, which meant a lot of points to be tested.
After adding a simple filter that threw out lines that are trivially not visible, what remained were about 155 million points to be tested on 37 thousand lines. That took 50 seconds with the code above.
Round 3: Fewer allocations
Taking a critical look at the function above, my instinct was to eliminate allocations. Looking at the process explorer confirmed that Firefox was allocating and releasing a lot of RAM, so it was reasonable to assume that GC pressure was a major drag on performance here.
One needless allocation is the array of points to be tested. The other happens here, where the tested pixel’s color is returned as an object:
let clrHere = getPixel(pixels, pt.x, pt.y);An improved version that avoids allocating the array and the points in it looks like this:
function get3JSMaskedLineNoAlloc(pt1, pt2, pixels, clr1, clr2) {

  const deltaX = pt2.x - pt1.x;
  const deltaY = pt2.y - pt1.y;
  const lineLength = Math.sqrt(deltaX ** 2 + deltaY ** 2);
  const nSegs = Math.max(2, Math.round(lineLength / segLen));
  testedPoints += nSegs + 1;

  let orto = pt2.subtract(pt1).rotate(90);
  orto.length = 1;

  let visibleLines = [];
  let firstVisible = null;
  let pt = new Point();
  let prevPt = new Point();

  for (let i = 0; i <= nSegs; ++i) {

    pt.x = pt1.x + i / nSegs * deltaX;
    pt.y = pt1.y + i / nSegs * deltaY;

    let clrHere = getPixel(pixels, pt.x, pt.y);
    let isVisible = clrEq(clrHere, clr1);
    if (!isVisible) isVisible = clrEq(clrHere, clr2);
    if (!isVisible) {
      clrHere = getPixel(pixels, pt.x + orto.x, pt.y + orto.y);
      isVisible = clrEq(clrHere, clr1);
      if (!isVisible) isVisible = clrEq(clrHere, clr2);
    }
    if (!isVisible) {
      clrHere = getPixel(pixels, pt.x - orto.x, pt.y - orto.y);
      isVisible = clrEq(clrHere, clr1);
      if (!isVisible) isVisible = clrEq(clrHere, clr2);
    }

    if (isVisible && firstVisible == null) {
      firstVisible = pt.clone();
    }
    else if (!isVisible && firstVisible != null) {
      if (!firstVisible.equals(prevPt)) visibleLines.push([firstVisible, prevPt.clone()]);
      firstVisible = null;
    }

    prevPt.x = pt.x;
    prevPt.y = pt.y;
  }
  if (firstVisible != null && !firstVisible.equals(pt2)) visibleLines.push([firstVisible, pt2.clone()]);
  return visibleLines;
}
With this function the crazy RAM usage was gone, and the execution time went down to about 16 seconds.
Round 3: Bare metal
Next I wanted to see what was the penalty of running this in Javascript, as opposed to running on bare metal. I added some helpers to download the canvas’s pixels and the lines to be tested as a text file with lots of numbers. I then implemented the same function as a small program in Go, which is my favorite language these days when I want to compile to machine code.
I’m sharing this program as a Gist: line-masker.go. It crunches the same lines in about 2.1 seconds in my environment.
Testing pixels in a shader
Getting from 300 seconds to 50 seconds to 16 seconds in Javascript was not bad, but I really wanted to see if this could be offloaded to the GPU for a dramatic improvement. This was my rough idea at the start:
- The points on different lines can be tested independently of each other, so there’s reason to expect a gain from GPU-style parallelism.
- I can put the masking image on a texture.
- Each tested line has 10 values: the XY coordinates of the two end points (2+2), and the RGB values of the two colors of the faces to each side (3+3). This data can fit into two additional textures because I can combine the six 8-bit RGB values into two 32-bit floats.
- A fragment shader using a dynamic loop can walk along a single line, and write the coordinates of the first and last visible points as four color values into an output texture.
- This way I can only find the first visible sub-segment of a line, not all visible sub-segments. But I can call the shader again for the rest of the line, until no more visible sub-segment is found.
There are two aspects of this that mean it only works on WebGL2, not WebGL. One is the need for textures with 32-bit float values. The other is the need for a dynamic loop.
I’ve uploaded the two shaders as a Gist, and I also uploaded the full Javascript file with the code that drives these shaders here: webgl-canvas-masker.js. (It includes some boilerplate code from WebGL2 Fundamentals[9].)
With this approach the line hiding calculations for my Cubic Space Division scene take about 30 msec.
A few remarks:
- If you’re at home with shaders, you’ll immediately notice that my shader code is very unidiomatic. It is full of if-conditions instead of expressing as much as possible mathematically. I am just a terrible noob with shaders, and the algebraic way of coding doesn’t come naturally to me yet.
- This coding style probably also hurts my shader’s performance. But: I’m not rendering an animation here where I have to fight for milliseconds to get a decent frame rate. Anything under a second or two is already good; 30 msec is beyond my wildest dreams.
- One concern I had starting out was about random memory access. As the loops of the fragment shaders proceed, they access different random parts of the image texture in parallel, which is not optimal. But apparently this is not a big issue.
- You’ll see that most of the Javascript code in the canvas masker class is just boilerplate that deals with loading the shaders, creating the textures, shoveling data into WebGL, and shoveling data out of WebGL. This is all a LOT of work, and any tiny mistake you make means it all just dies. The final result is spectacular, but it’s not something I’d do every day.
- I’ll have to look into going through Three.js for this sort of GPGPU application. I’ve always thought of Three.js as something that focuses on meshes and rendering actual 3D graphics, but it might well make using shaders like this a lot easier too.
A failed attempt at depth testing
The face coloring approach’s performance is remarkable, but it does have a few downsides:
- The need to look to the side at the edges of colored regions is... not so elegant? Also, it hurts precision at the ends of the tested lines.
- The calling code must keep track of face colors so it knows what colors to look for when testing each line.
- In a complicated composition there will be more faces than reliably distinguishable colors. If identically colored faces in different depths overlap in the 2D projection, deeper lines that are blocked from view will be kept incorrectly.
In the hope of avoiding these problems I attempted to derive a slightly different approach based on depth values. Those are written by fragment shaders (the real ones, used for rendering) into the W values in the output texture. It is possible to retrieve depth values when using Three.js with a trick involving two render passes, as shown in the depth texture example.[10] I hoped I could compare depth values with the distance from the camera plane of each point along an edge to decide if that point of the edge is visible or not.
I managed to make this work under some circumstances, but not reliably. Somehow the resolution of the retrieved depth values seems to be too small, even if I specify a 24-bit depth texture. I gave up on this after a long fruitless struggle, but if you can make it work, I would love to see the result!
It’s a wrap!
This text ended up being way too long already... As a concise summary, here are my measurements again from the different methods.
| Approach | Time |
| Javascript, naive, lots of superfluous calculations | 300 sec |
| Javascript, naive, avoiding trivially invisible lines | 50 sec |
| Javascript, reduced allocations | 16 sec |
| Bare metal (Go) | 2.1 sec |
| WebGL | 30 msec |
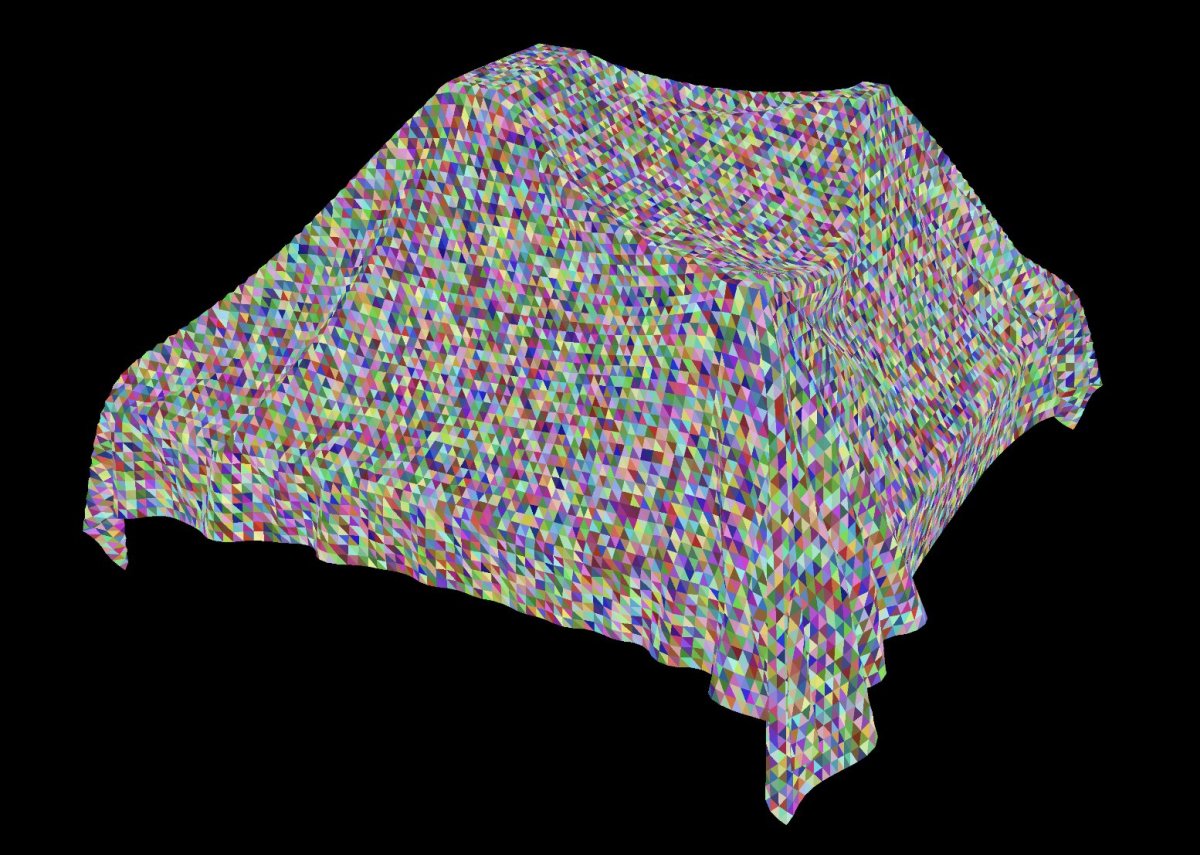
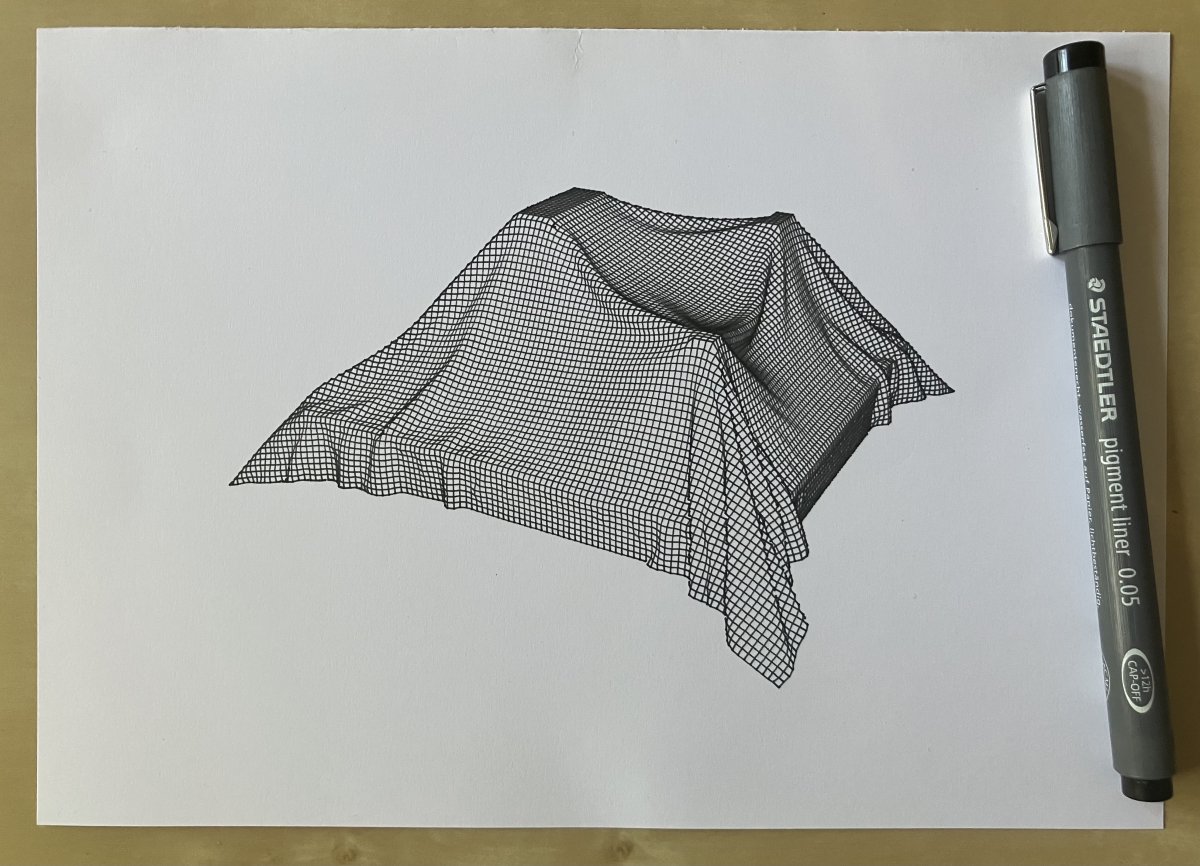
To wrap it all up, here’s another composition enabled by the fast WebGL-based line hiding method. This is the output of a cloth simulation based on Verlet integration. The veil is a 120x120 grid of squares, each made up of two triangles. It is also my most recent plot :)
References
[2] blender.org
[3] paperjs.org
[4] threejs.org
[6] web.archive.org/web/20210429082853/https://twitter.com/zancan/status/1387685194468110337
[7] turtletoy.net/turtle/25b7bc4d43
[8] wikiart.org/en/m-c-escher/cubic-space-division
[10] threejs.org/examples/?q=depth#webgl_depth_texture
[11] trmm.net/Plotter-Vision; source: github.com/osresearch/plotter-vision