Plot #021
Generated by: Sketch 42 / temperature charts
© Gábor L Ugray CC BY-NC-SA
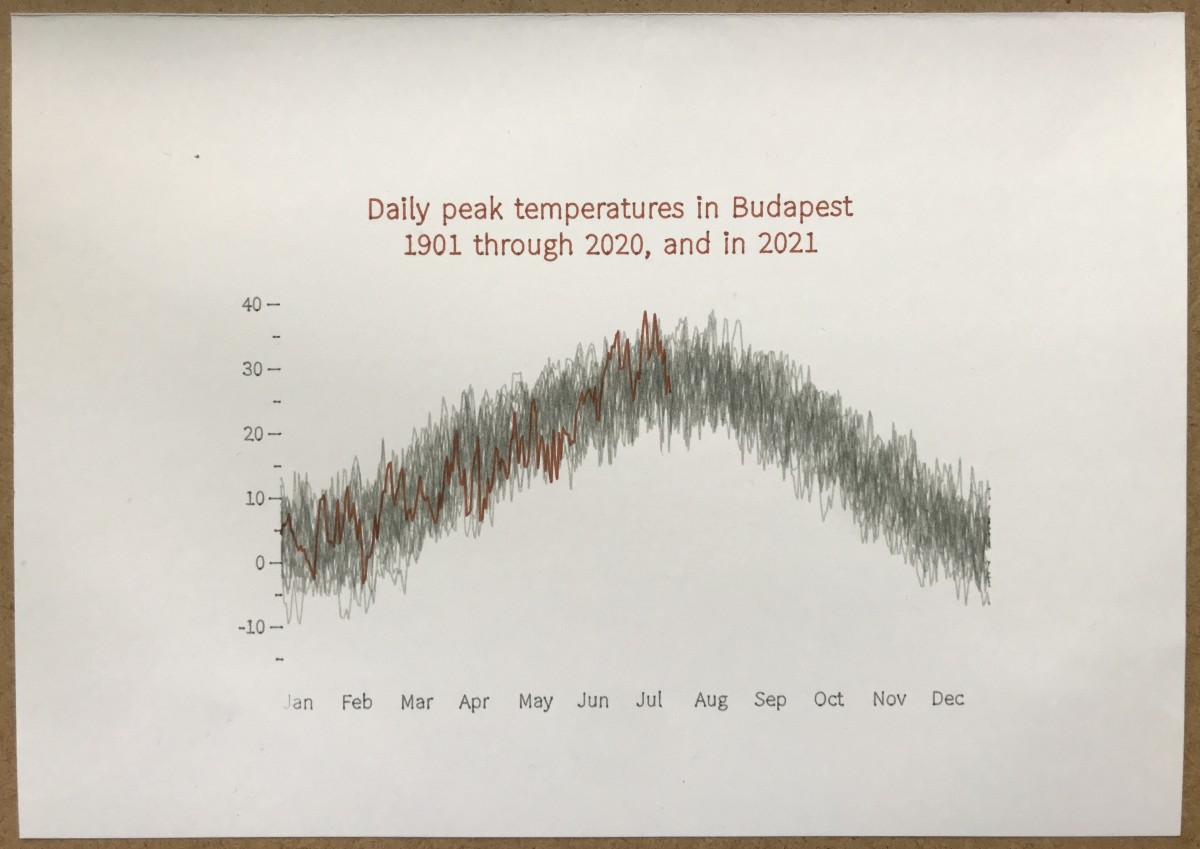
People first built plotters to visualize data. Back to the roots, then. Can you spot the heat wave?
Generated by: Sketch 42 / temperature charts
© Gábor L Ugray CC BY-NC-SA
People first built plotters to visualize data. Back to the roots, then. Can you spot the heat wave?