Plot #058source code
Generated by: Sketch 111 / line density (a, b, c)
© Gábor L Ugray CC BY-NC-SA
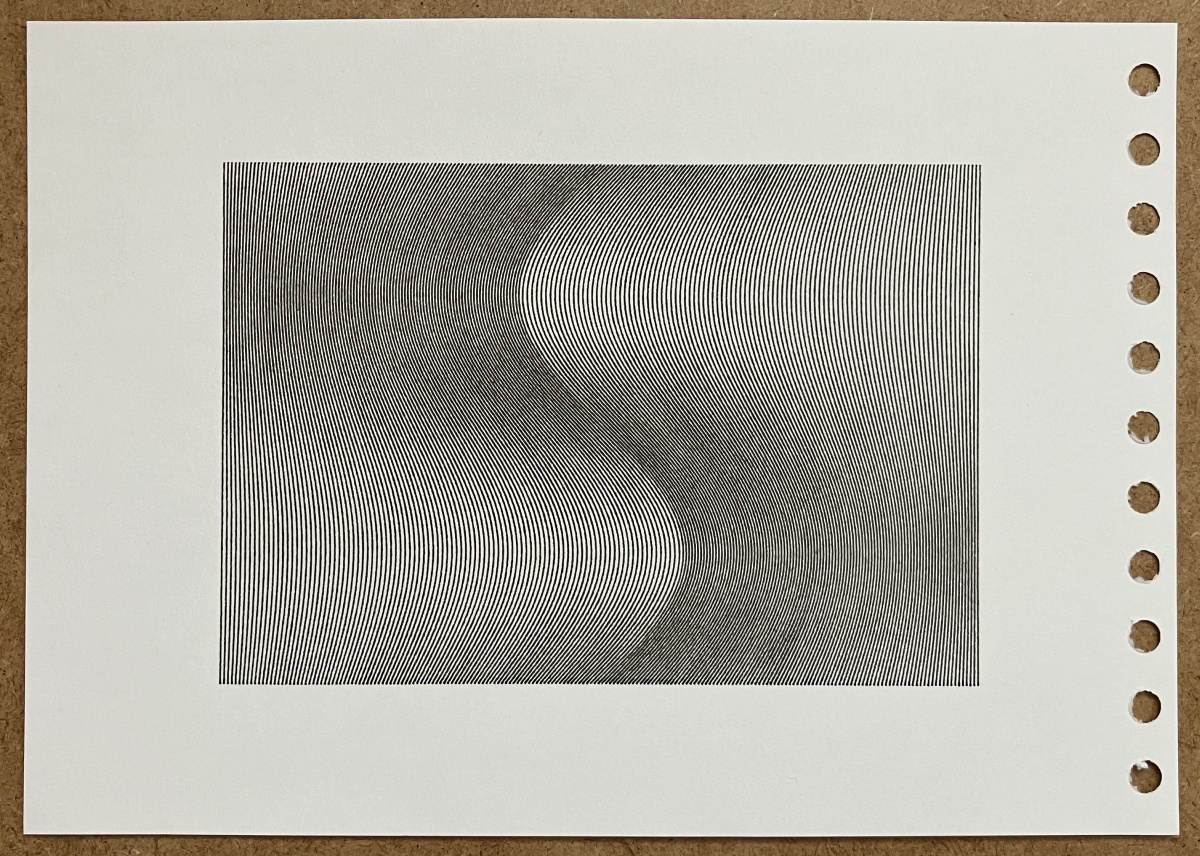
The first image is a recreation of Matt Lehoullier's "Sine Oscillation" plot shared on Twitter: twitter.com/m_houll/status/1782016031449374756
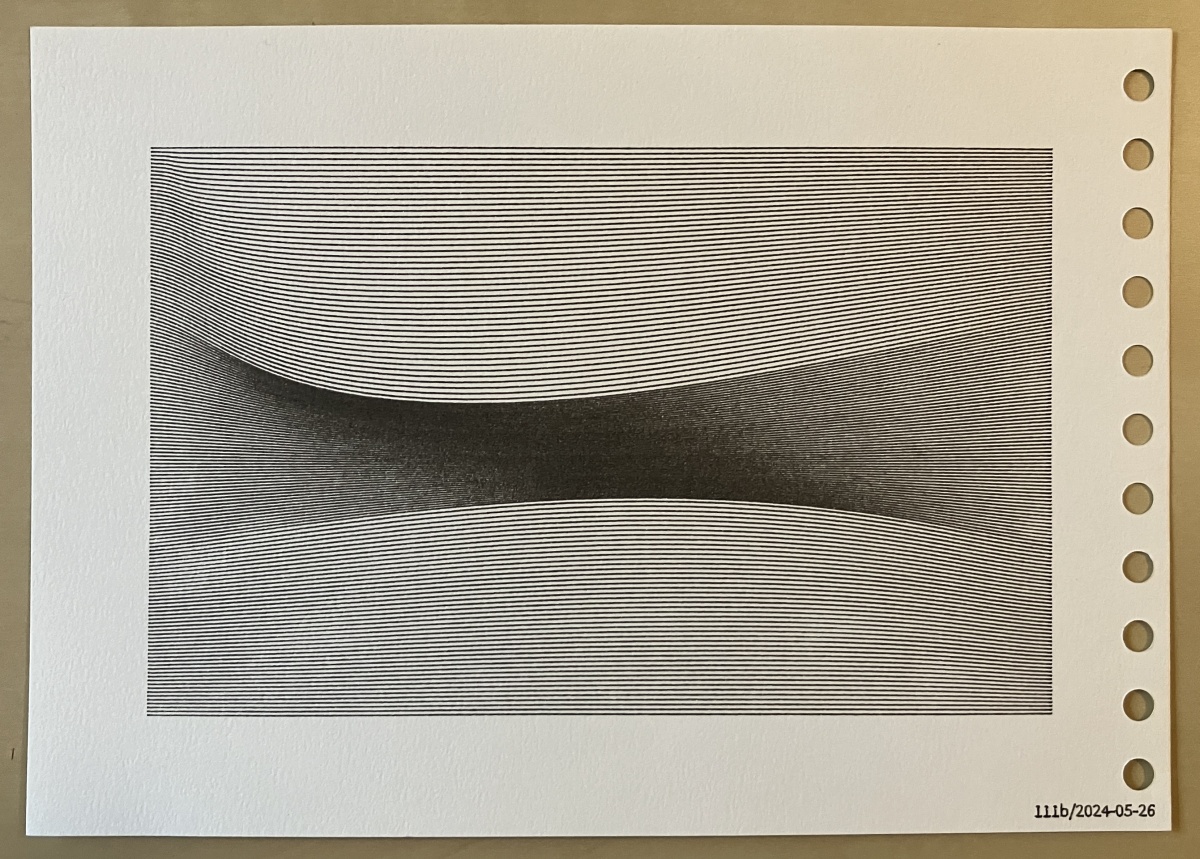
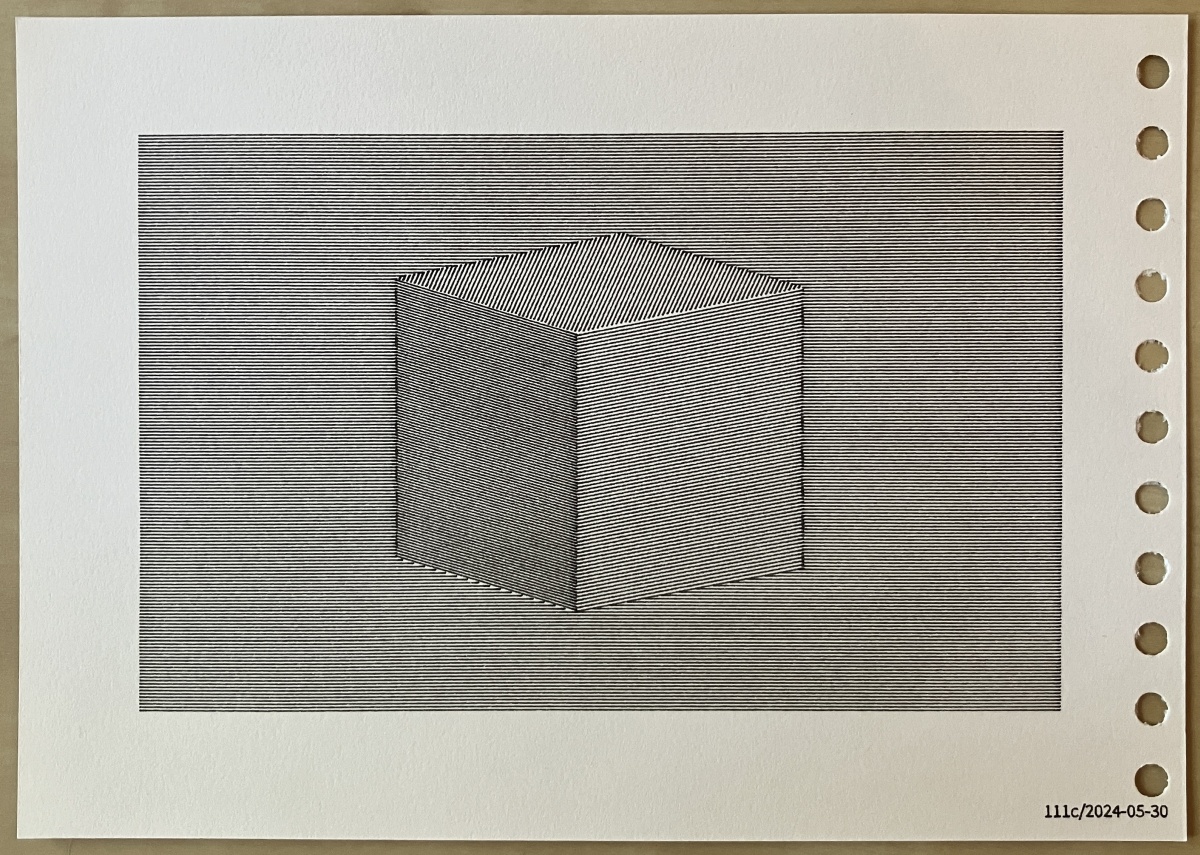
I recreated this composition and looked for ways to develop it into different shapes and impressions. All of these images are based on the idea of lines that run parallel at the edges, but vary their density in between.
The Moiree effect you may be seeing is not intentional; if it's there, it's just a screen artifact.